Jacki: Turning Financial Data Into Usable Insight
Project
Jacki, financial analysis platform for property management operations
Problem
No documentation, unclear requirements, and no defined product structure
Role
Information architecture, UX design, and product definition
Approach
Mapped backend data, defined system structure, built reusable components
Outcome
Shifted from ambiguity to structured, build-ready system across all surfaces
This case study follows the structure work behind Jacki, a financial analysis platform for property management.
The project began without clear documentation, defined requirements, or a stable product model.
My work focused on turning that ambiguity into a structured system developers could build from and stakeholders could understand.
Problem
- No defined product structure or technical foundation
- Requirements fragmented across conversations, not formalized
- No shared system understanding between stakeholders and developers
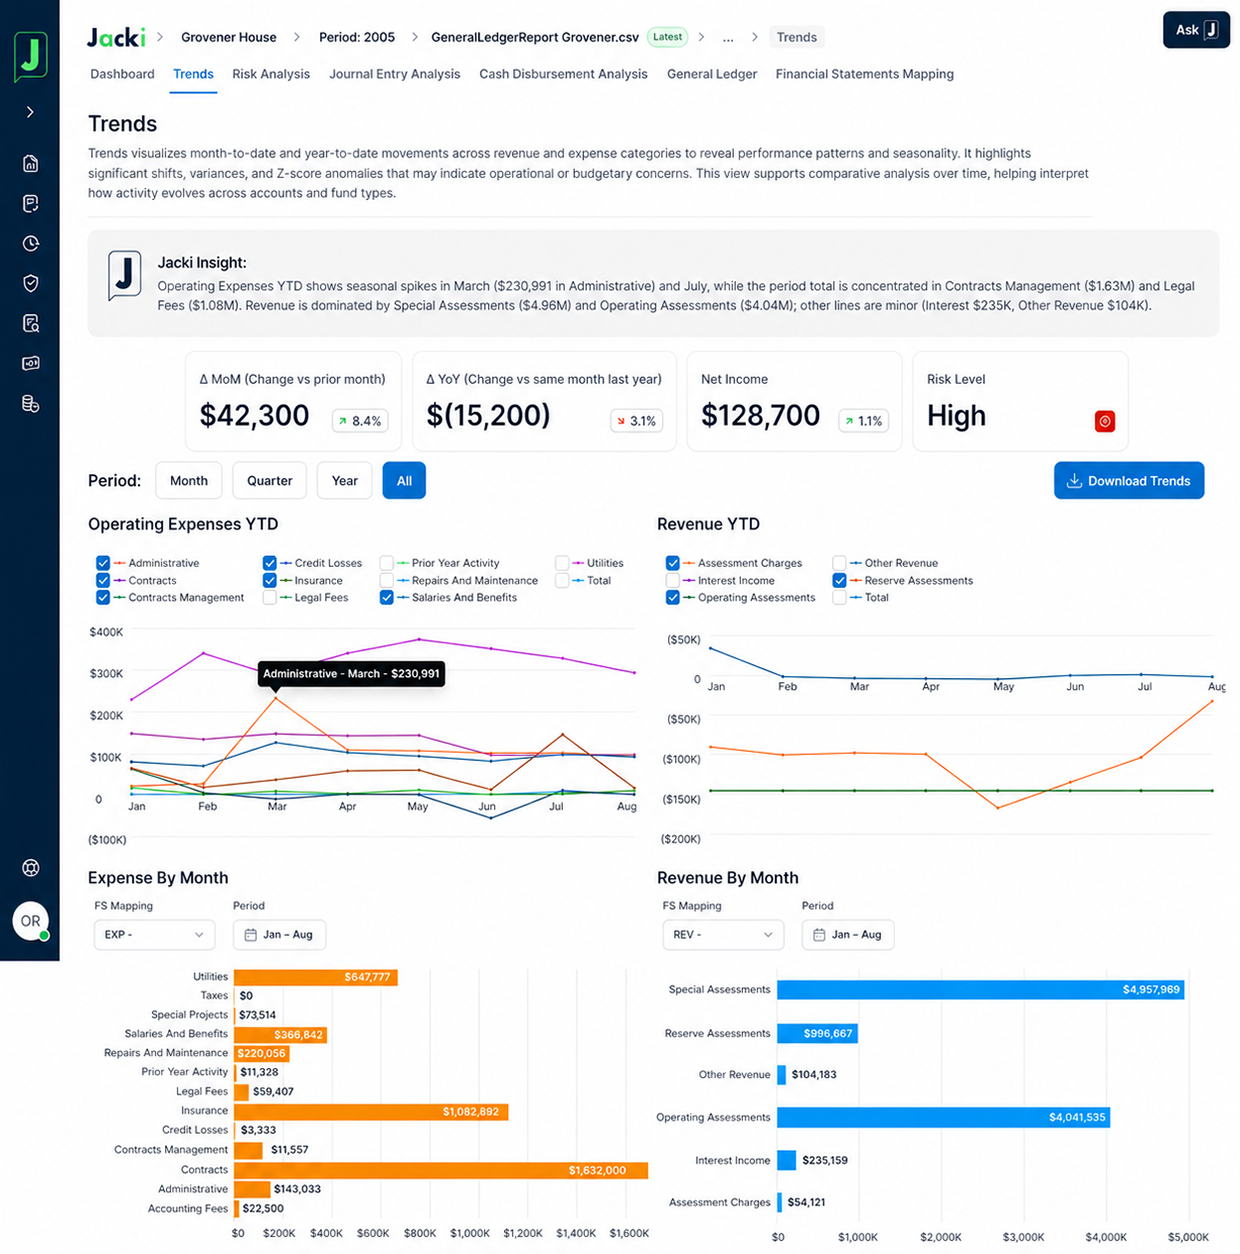
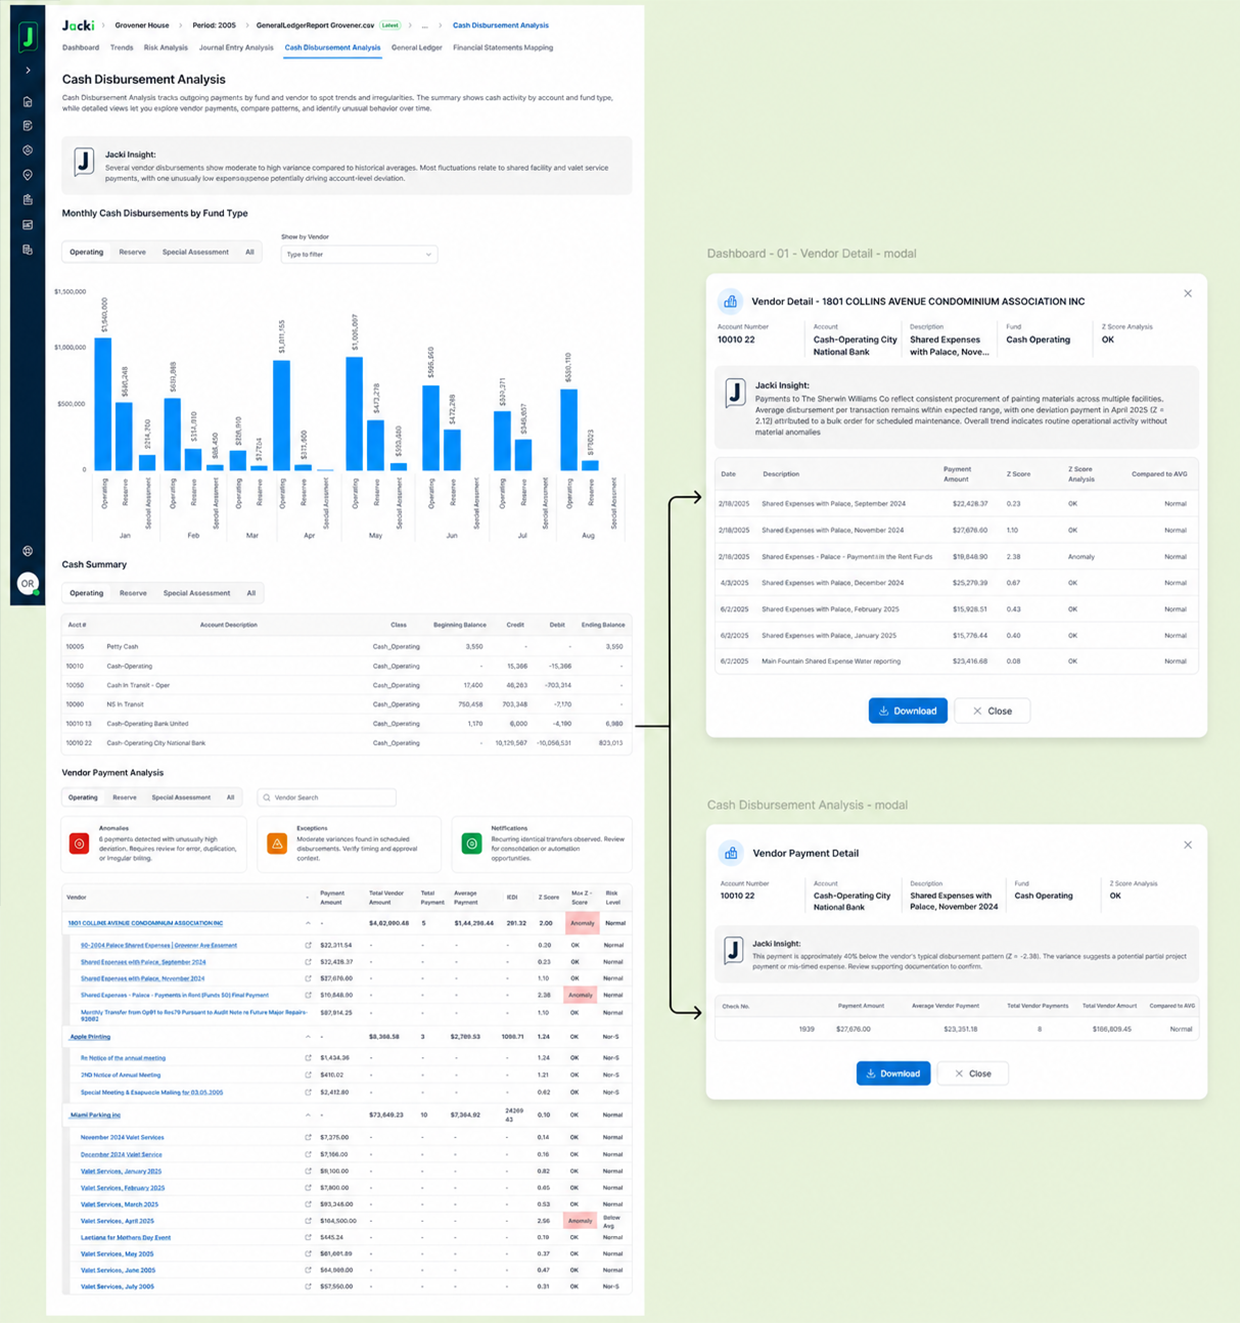
The system was built on raw general ledger exports, dense and technical, and not usable by the people responsible for financial decisions. Property managers and HOA boards needed to understand risk, vendor activity, and reserve health, but the data did not surface those signals without expert interpretation.
At the same time, the domain was complex and high-stakes. The platform needed to handle multi-property financial data, anomaly detection, and reserve calculations while maintaining accuracy a CPA could trust. Simplification risked misrepresentation, and errors had real consequences.
The product itself had no defined structure. Requirements were fragmented, the data logic was undocumented, and prior work mixed backend logic with UI behavior. The result was a set of disconnected pieces rather than a coherent system.
The client, a CPA and business owner, had lost confidence after unclear direction and lack of alignment. He needed a tool that could translate financial data into clear explanations for non-experts, but the product was not yet positioned to do that.
Role
- Owned system structure across data, interface, and user flows
- Bridged backend logic and user-facing design decisions
- Owned product definition in absence of formal direction
The role extended beyond traditional UX design. There was no clear product owner, no defined system architecture, and no separation between backend logic and interface behavior. My work focused on establishing structure across the system, from data organization to user interaction.
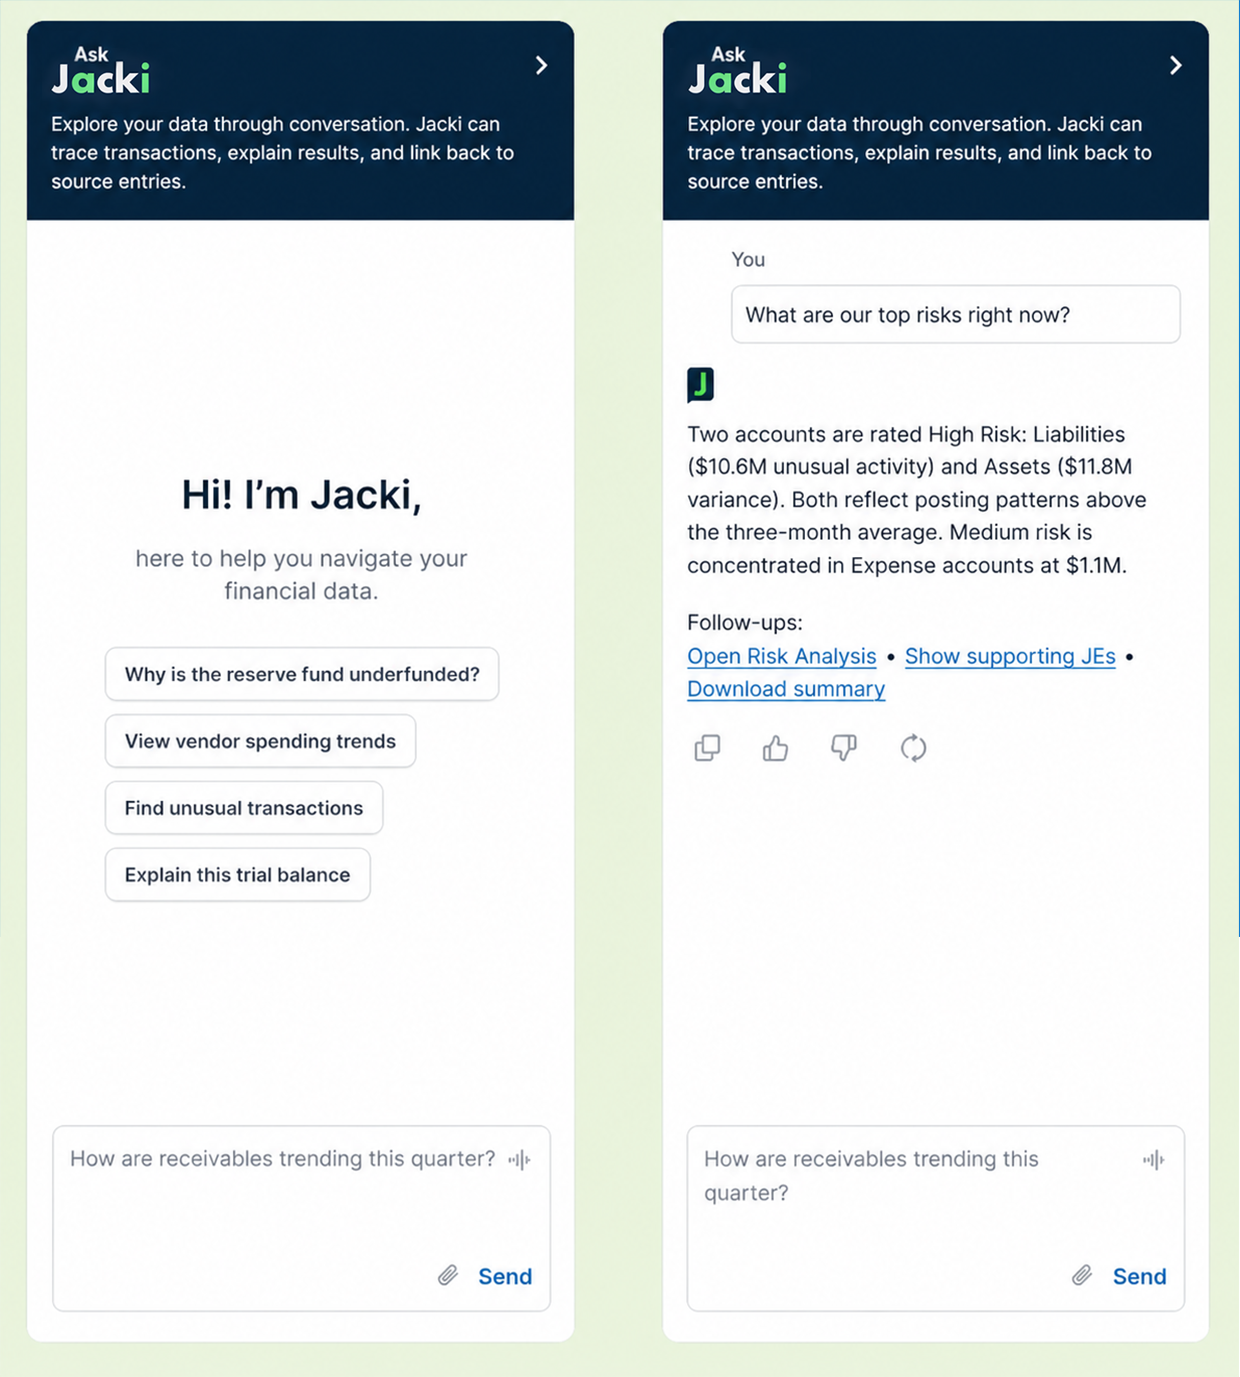
This required translating backend financial logic into usable interface patterns while preserving accuracy. Each design decision had to reflect how the data was generated, calculated, and interpreted, not just how it was displayed.
At the same time, I took ownership of product definition. This included clarifying requirements, aligning stakeholders around a shared structure, and defining how the system should behave across different use cases.
Approach
- Structured backend data into a usable system model
- Defined consistent surfaces and interaction patterns
- Built reusable components to support system scalability
The work started by understanding and structuring the underlying data. The platform relied on raw financial inputs that needed to be organized into a coherent system model before any interface decisions could be made.
From there, I defined the core surfaces of the product, establishing how users would navigate, interpret, and act on financial information. Each surface was designed to reflect a specific function within the system rather than a collection of disconnected screens.
To support consistency and scalability, I built a set of reusable components aligned with the system structure. This allowed the product to grow without introducing fragmentation or inconsistencies across different areas.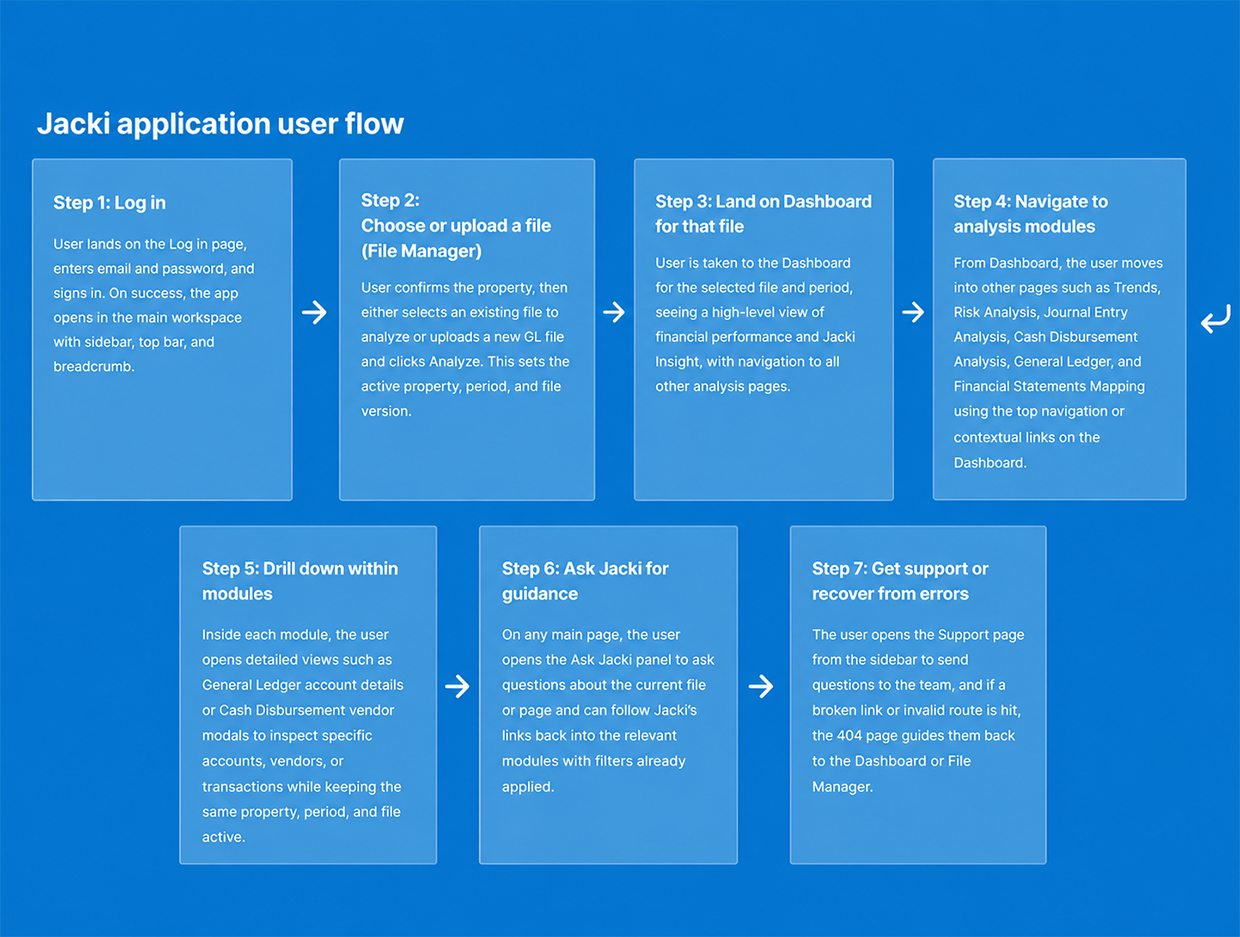
Key Decisions
Critical decisions that shaped how the system works and how users interact with it.
Outcome
- Established a structured, build-ready system across all surfaces
- Aligned product, design, and development around a shared model
- Enabled implementation without ambiguity or redefinition
The result was a system that could be understood and built consistently. Instead of fragmented ideas and undocumented logic, the product had a clear structure that aligned stakeholders and developers around the same model.
This reduced ambiguity across the implementation process. Developers could work from defined surfaces and components, and decisions no longer required constant reinterpretation or clarification.
At the same time, the product became more effective for its intended users. Financial data could be translated into structured outputs that supported decision-making without requiring expert interpretation at every step.